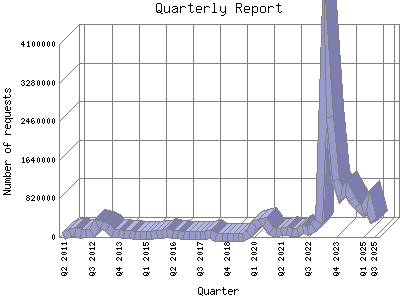
The Quarterly Report shows total activity on your site for each quarter of a
year. Remember that each page hit can result in several server requests as the
images for each page are loaded.
Note: Most likely, the first and
last quarters will not represent a complete quarter's worth of data, resulting
in lower hits.
| Quarter | Number of requests | Percentage of the requests | |
|---|---|---|---|
| 1. | Q2 2026 | 109,065 | 0.52% |
| 2. | Q1 2026 | 1,316,400 | 6.32% |
| 3. | Q4 2025 | 1,129,038 | 5.42% |
| 4. | Q3 2025 | 1,058,754 | 5.9% |
| 5. | Q2 2025 | 772,398 | 3.71% |
| 6. | Q1 2025 | 546,198 | 2.62% |
| 7. | Q4 2024 | 662,695 | 3.19% |
| 8. | Q3 2024 | 797,122 | 3.82% |
| 9. | Q2 2024 | 1,041,096 | 5% |
| 10. | Q1 2024 | 895,710 | 4.30% |
| 11. | Q4 2023 | 1,216,182 | 5.84% |
| 12. | Q3 2023 | 2,558,934 | 12.30% |
| 13. | Q2 2023 | 4,072,932 | 19.57% |
| 14. | Q1 2023 | 326,234 | 1.57% |
| 15. | Q4 2022 | 194,201 | 0.93% |
| 16. | Q3 2022 | 135,508 | 0.66% |
| 17. | Q2 2022 | 167,280 | 0.80% |
| 18. | Q1 2022 | 115,983 | 0.56% |
| 19. | Q4 2021 | 107,886 | 0.51% |
| 20. | Q3 2021 | 117,098 | 0.57% |
| 21. | Q2 2021 | 98,006 | 0.48% |
| 22. | Q1 2021 | 88,894 | 0.42% |
| 23. | Q4 2020 | 117,696 | 0.57% |
| 24. | Q3 2020 | 322,003 | 1.54% |
| 25. | Q2 2020 | 299,476 | 1.43% |
| 26. | Q1 2020 | 265,170 | 1.28% |
| 27. | Q4 2019 | 58,762 | 0.29% |
| 28. | Q3 2019 | 0 | 0% |
| 29. | Q2 2019 | 0 | 0% |
| 30. | Q1 2019 | 0 | 0% |
| 31. | Q4 2018 | 0 | 0% |
| 32. | Q3 2018 | 0 | 0% |
| 33. | Q2 2018 | 9,766 | 0.4% |
| 34. | Q1 2018 | 54,103 | 0.27% |
| 35. | Q4 2017 | 40,737 | 0.20% |
| 36. | Q3 2017 | 32,848 | 0.16% |
| 37. | Q2 2017 | 48,810 | 0.23% |
| 38. | Q1 2017 | 44,157 | 0.21% |
| 39. | Q4 2016 | 51,550 | 0.24% |
| 40. | Q3 2016 | 55,250 | 0.27% |
| 41. | Q2 2016 | 56,091 | 0.27% |
| 42. | Q1 2016 | 79,490 | 0.39% |
| 43. | Q4 2015 | 57,943 | 0.28% |
| 44. | Q3 2015 | 55,637 | 0.27% |
| 45. | Q2 2015 | 44,293 | 0.21% |
| 46. | Q1 2015 | 42,270 | 0.20% |
| 47. | Q4 2014 | 48,034 | 0.23% |
| 48. | Q3 2014 | 50,530 | 0.24% |
| 49. | Q2 2014 | 62,569 | 0.30% |
| 50. | Q1 2014 | 66,477 | 0.31% |
| 51. | Q4 2013 | 75,186 | 0.37% |
| 52. | Q3 2013 | 83,012 | 0.40% |
| 53. | Q2 2013 | 201,289 | 0.97% |
| 54. | Q1 2013 | 247,639 | 1.20% |
| 55. | Q4 2012 | 265,603 | 1.28% |
| 56. | Q3 2012 | 82,952 | 0.40% |
| 57. | Q2 2012 | 79,626 | 0.39% |
| 58. | Q1 2012 | 69,515 | 0.33% |
| 59. | Q4 2011 | 108,536 | 0.52% |
| 60. | Q3 2011 | 93,047 | 0.44% |
| 61. | Q2 2011 | 18,162 | 0.9% |
Most active quarter Q2 2023 : 4,072,932 requests handled.
Quarterly average: 371711 requests handled.
This report was generated on April 16, 2026 01:02.
Report time frame June 19, 2011 05:01 to April 15, 2026 04:59.
| Web statistics report produced by: | |
 Analog 5.24 Analog 5.24 |  Report Magic for Analog 2.13 Report Magic for Analog 2.13 |